The Best US States to Win the Lottery

Winning the lottery might be everyone’s dream, but some states seem to have luck on their side, while others are just tossing cash at a long shot.
To identify the best states for winning the lottery, we analyzed data from the past decade of Mega Millions and Powerball winners, adjusting for population, total prize payouts, average lottery spending per capita, and other key factors to develop our Lottery Win Index. Here’s what we uncovered:

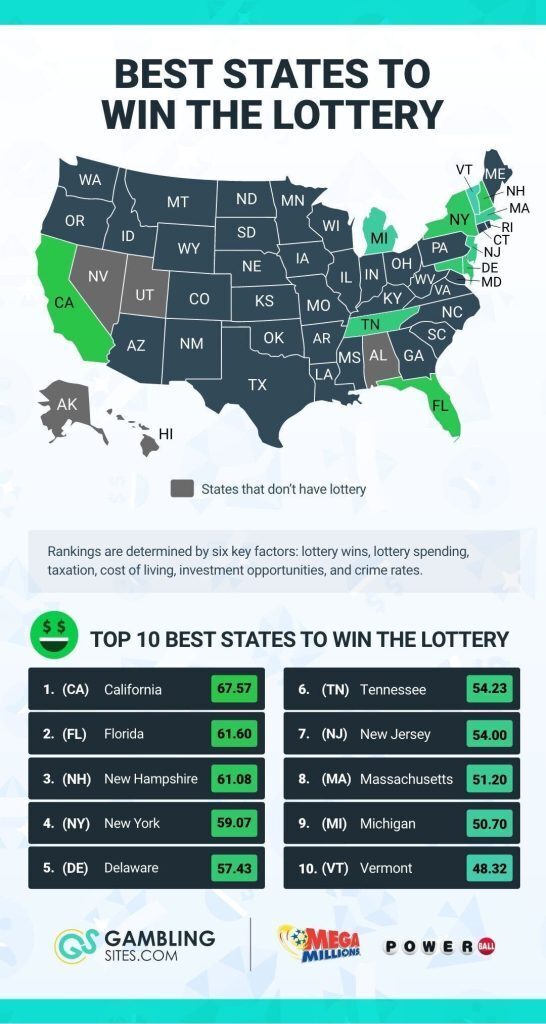
Top 5 Best States to Win The Lottery

The top 5 states on our Lottery Win Index collectively brought in twenty-three billion dollars from 62 Mega Millions and Powerball winners over the last ten years. 22 of those came from California, but the odds per person are stronger in New Hampshire, with 2.14 winners per 10 million people. That’s twelve times more than in states like Rhode Island and Maryland.
Let’s break down the details:
California – Leading With 22 Winners in the Last 10 Years
California leads our Lottery Win Index with 22 jackpot winners and $11.9 billion in prizes over the past decade, making it the most successful state for lottery gambling in the U.S. What’s interesting is players only spend about $25.23 a month, showing you don’t need to go big to win big.
Winnings aren’t taxed at the state level, so more cash stays in your pocket compared to places like Oregon and South Carolina. On top of that, being #2 in venture capital funding, California gives winners plenty of opportunities to invest or even start businesses with their money.
Florida – A Close Second With Over $6 Billion in Mega Millions and Powerball Wins
Florida ranks second overall for lottery luck, backed by 15 jackpot winners and $6.03 billion in total payouts. Players stay active, with high participation rates, even though monthly spending averages a modest $44.81 per person. Again, there’s no state tax on lottery winnings.
Living costs can be a bit high, and investment options are more middle-of-the-road, but the low crime rate makes it a safer, more relaxed spot for managing big payouts.
New Hampshire – Small State but Big Winners in the Mix
With only three winners in the last decade, you might scratch your head wondering how The Granite State landed in our top five best states to win the lottery. But once you stack up the population against others, the numbers tell a different story—a staggering 2.14 winners per 10 million people and $1.21 billion in total payouts.
The average monthly lottery spend here comes in just above Florida’s at $45.61, and similarly, there’s no state tax on winnings. The cost of living’s a bit high, but strong schools, low crime rates, and plenty of outdoor recreation make it a pretty solid trade-off for many.
New York – Spending Big and Winning Bigger ($4.2 Billion)
New York’s the city that never sleeps—probably because half of it is busy playing the lottery. It ranks fourth in monthly spending per person at $84.69, but to be fair, luck showed up, delivering 21 winners and $4.2 billion over the last decade.
Sure, the state grabs its 8.82% cut in taxes, but what’s left lands in a place loaded with investment potential—whether it’s finance, real estate, tech startups, or entertainment—all fueled by a global economy and top-tier talent.
Delaware – Winners Stay Totally Anonymous
Just like New Hampshire, you’ve got to factor in the low population to see why Delaware made the list. It’s had just one winner in the last ten years, but that works out to 0.96 winners per 10 million people—not too shabby for a smaller state.
What really sets Delaware apart, though, is its anonymity laws. If you hit it big, you can keep your name out of the spotlight—no random calls, no long-lost friends, and no media frenzy chasing you down.
The Worst States to Win the Lottery

If you’re someone who lives and breathes stats, then New Mexico and Montana are probably the last places you’d want to try your luck in the lottery. Here’s why they’re stuck at the bottom of the pile:
New Mexico – Zero Wins in the Previous Decade
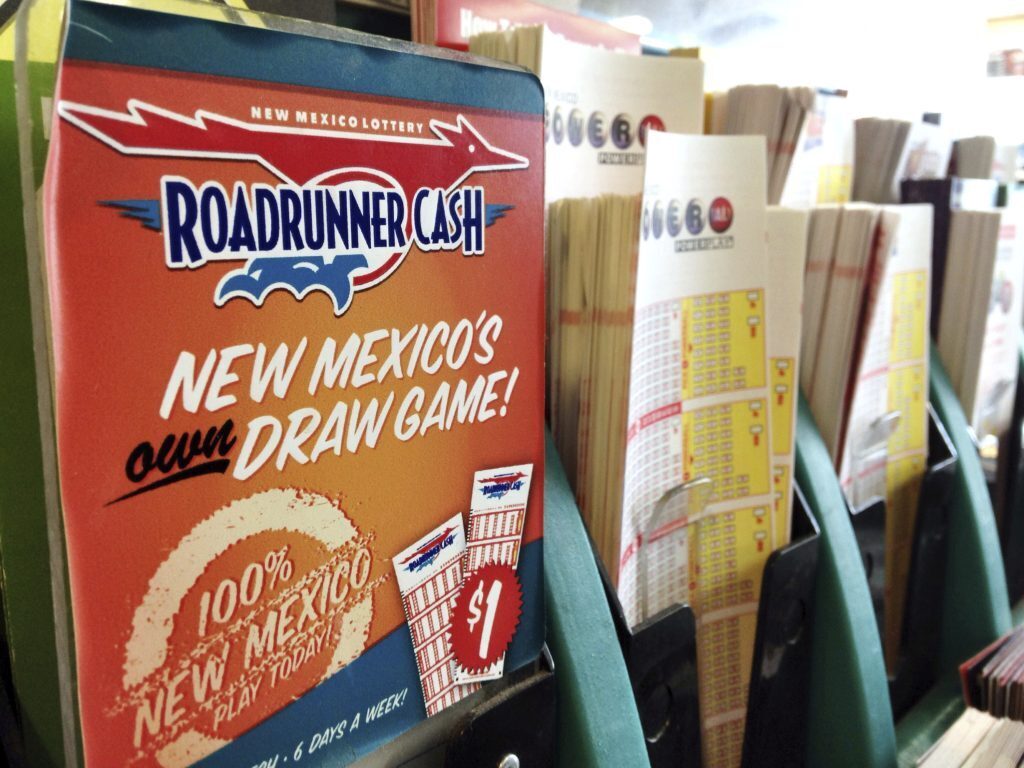
New Mexico hasn’t made much noise in national lotteries like Mega Millions or Powerball, with zero big wins over the last decade. But then again, it looks like lottery fever never really caught on since it became legal in 1995—the average spend per person sits at just $8.44 a month, way below the national average.
Based on what we’ve heard from past winners, New Mexico doesn’t seem like a top pick for relocating—mostly because it has the highest crime rate in the U.S. and not much going on when it comes to investment opportunities.
Montana — In the Same Boat as the Worst State to Win the Lottery
Montanans aren’t going all in on the lottery either, spending just $9 a month per person on average. Like New Mexico, they’ve gone a full decade without seeing a Mega Millions or Powerball jackpot winner.
Add to that a 6.9% tax on winnings, and it’s not exactly a dream scenario for players. People have been chasing that big win for years, but the longer this streak drags on, the more it feels like they’re funding the state than getting anything back.
Arkansas — One Win, Nothing Else to Cheer
Meanwhile, over in the Natural State, the grass isn’t any greener, with only 0.32 winners per 10 million people—making it among the worst in the country.
The only one likely to argue otherwise would be the lone jackpot winner, who walked away with $117,000,000. On average, people here spend $21.43 on the lottery, which stands below the national figure of $35.72.
Regional Insights and Trends for Lottery Wins
As we were pulling data, our analysts spotted some pretty interesting patterns across regions in the national lottery scene. The most notable ones are:
High Spending Doesn’t Always Mean Luck
Massachusetts ($90.17/month), Rhode Island ($95.93/month), and Maryland ($90.11/month) rank among the highest average spending per person, yet they still don’t show up at the top of the Lottery Win Index or total prize amounts won. It’s a clear reminder that putting in more doesn’t always translate to winning big, especially in states with dense populations where competition is fierce.
The Best Lottery Winning Region
New England holds its own in the lottery scene. Massachusetts sits at 9th on our Lottery Win Index, while New Hampshire takes 3rd, leading in spending per person and standing out in winners per capita. Even Vermont, with fewer players, benefits from a more concentrated pool of competitors.
Large States Dominate Total Winnings
It’s no surprise that states like California and Florida produce more winners—they sell way more tickets thanks to their huge populations. The fact that they also rank high in average spending helps, but that’s more about individual participation than just volume alone.
Texas, though, throws a curveball—it’s the second most populous state, yet it only ranks 11th on the Lottery Win Index.
Methodology
To clearly understand how states rank for lottery success without relying on third-party data and interpretations, we gathered information from primary sources across multiple metrics to build our own Lottery Win Index.
Here’s a closer look:
Data Sources
This article is based on data sourced from state lottery boards, national lottery reports, and other verified authorities. We analyzed comprehensive statistics on Powerball and Mega Millions winners, including ticket purchase locations, jackpot figures, and per-capita lottery spending in each state.
Our team also factored in additional metrics such as cost of living indexes, state investment performance, tax implications for winnings, and crime statistics to paint a more detailed story for each state.
The Lottery Win Index
The Lottery Win Index is our proprietary metric, designed to provide a comprehensive measure of lottery success across states. It combines the total number of lottery winners for Mega Millions and Powerball, adjusted to reflect winners per 10 million residents—to account for population differences—over a 10-year period.
The index also factors in the total prize money won and correlates it with the average monthly lottery spending per person in each state.
Of course, states like Alaska, Alabama, Nevada, Hawaii, and Utah, which don’t have state lotteries, are excluded since they can’t produce Mega Millions or Powerball winners.
Let’s review how the data we’ve compiled ranks all 45 states participating in the lotteries:
| # | State | Lottery Win Index (/100) |
|---|---|---|
| 1 | California | 67.57 |
| 2 | Florida | 61.60 |
| 3 | New Hampshire | 61.08 |
| 4 | New York | 59.07 |
| 5 | Delaware | 57.43 |
| 6 | Tennessee | 54.23 |
| 7 | New Jersey | 54.00 |
| 8 | Massachusetts | 51.20 |
| 9 | Michigan | 50.70 |
| 10 | Vermont | 48.32 |
| 11 | Illinois | 48.24 |
| 12 | Texas | 48.09 |
| 13 | Pennsylvania | 48.01 |
| 14 | Ohio | 45.34 |
| 15 | Virginia | 45.31 |
| 16 | Rhode Island | 45.09 |
| 17 | Maryland | 44.48 |
| 18 | Wyoming | 44.13 |
| 19 | Missouri | 42.84 |
| 20 | Washington | 42.23 |
| 21 | Georgia | 41.80 |
| 22 | West Virginia | 40.35 |
| 23 | Maine | 39.70 |
| 24 | Indiana | 39.66 |
| 25 | Arizona | 39.03 |
| 26 | South Dakota | 37.05 |
| 27 | Wisconsin | 37.03 |
| 28 | Connecticut | 36.91 |
| 29 | North Carolina | 36.90 |
| 30 | Colorado | 34.75 |
| 31 | Iowa | 34.10 |
| 32 | Minnesota | 32.13 |
| 33 | Idaho | 31.42 |
| 34 | Kansas | 31.04 |
| 35 | Kentucky | 30.82 |
| 36 | North Dakota | 29.72 |
| 37 | Nebraska | 29.30 |
| 38 | Oregon | 27.84 |
| 39 | Mississippi | 26.49 |
| 40 | South Carolina | 26.17 |
| 41 | Louisiana | 26.10 |
| 42 | Oklahoma | 25.25 |
| 43 | Arkansas | 23.94 |
| 44 | Montana | 23.22 |
| 45 | New Mexico | 22.14 |
Did Your State Make the List?
The truth is, the next multi-million-dollar Powerball or Mega Millions jackpot could be won anywhere—but living in a state that tops the Lottery Win Index, like California, Florida, or New Hampshire, certainly doesn’t hurt.
Luck plays the biggest role—if it’s meant for you, it’s yours—but the data does reveal some fascinating trends about where those big wins seem to land more often.
Stay connected with us on X, Tiktok and Instagram for more intriguing lottery trends, tips, and insights.
 75%
75% 80%
80%